You can run and edit these examples interactively on Galaxy
Load a Study from the MGnify API and fetch its Analyses
The MGnify API returns JSON data. The jsonapi_client package can help you load this data into Python, e.g. into a Pandas dataframe.
This example shows you how to load a MGnify Study’s Analyses from the MGnify API
You can find all of the other “API endpoints” using the Browsable API interface in your web browser. The URL you see in the browsable API is exactly the same as the one you can use in this code.
This is an interactive code notebook (a Jupyter Notebook). To run this code, click into each cell and press the ▶ button in the top toolbar, or press shift+enter.
Select a Study
Pick a particular Study of interest. If you followed a link to this notebook, we might already know the Study Accession. Otherwise, you can enter one or use the example:
from lib.variable_utils import get_variable_from_link_or_input# You can also just directly set the accession variable in code, like this:# accession = "MGYS00005292"accession = get_variable_from_link_or_input('MGYS', 'Study Accession', 'MGYS00005292')
Using Study Accession MGYS00005292 from the link you followed.
Using "MGYS00005292" as Study Accession
Fetch data
Fetch Analyses for this study from the MGnify API, into a Pandas dataframe
from jsonapi_client import Sessionimport pandas as pdwith Session("https://www.ebi.ac.uk/metagenomics/api/v1") as mgnify: analyses =map(lambda r: r.json, mgnify.iterate(f'studies/{accession}/analyses')) analyses = pd.json_normalize(analyses)
Inspect the data
The .head() method prints the first few rows of the table
analyses.head()
type
id
attributes.pipeline-version
attributes.accession
attributes.analysis-summary
attributes.experiment-type
attributes.analysis-status
attributes.is-private
attributes.last-update
attributes.complete-time
attributes.instrument-platform
attributes.instrument-model
relationships.sample.data.id
relationships.sample.data.type
relationships.run.data.id
relationships.run.data.type
relationships.study.data.id
relationships.study.data.type
0
analysis-jobs
MGYA00448077
4.1
MGYA00448077
[{'key': 'Submitted nucleotide sequences', 'va...
amplicon
completed
False
2024-01-29T15:29:19.757516
2020-01-31T08:26:49
ILLUMINA
Illumina HiSeq 2500
SRS2065862
samples
SRR6132556
runs
MGYS00005292
studies
1
analysis-jobs
MGYA00448078
4.1
MGYA00448078
[{'key': 'Submitted nucleotide sequences', 'va...
amplicon
completed
False
2024-01-29T15:29:19.757516
2020-01-31T08:27:25
ILLUMINA
Illumina HiSeq 2500
SRS2065861
samples
SRR6132555
runs
MGYS00005292
studies
2
analysis-jobs
MGYA00448079
4.1
MGYA00448079
[{'key': 'Submitted nucleotide sequences', 'va...
amplicon
completed
False
2024-01-29T15:29:19.757516
2020-01-31T08:28:04
ILLUMINA
Illumina HiSeq 2500
SRS2065860
samples
SRR6132554
runs
MGYS00005292
studies
3
analysis-jobs
MGYA00448080
4.1
MGYA00448080
[{'key': 'Submitted nucleotide sequences', 'va...
amplicon
completed
False
2024-01-29T15:29:19.757516
2020-01-31T08:28:42
ILLUMINA
Illumina HiSeq 2500
SRS2065859
samples
SRR6132553
runs
MGYS00005292
studies
4
analysis-jobs
MGYA00448081
4.1
MGYA00448081
[{'key': 'Submitted nucleotide sequences', 'va...
amplicon
completed
False
2024-01-29T15:29:19.757516
2020-01-31T08:29:18
ILLUMINA
Illumina HiSeq 2500
SRS2065858
samples
SRR6132552
runs
MGYS00005292
studies
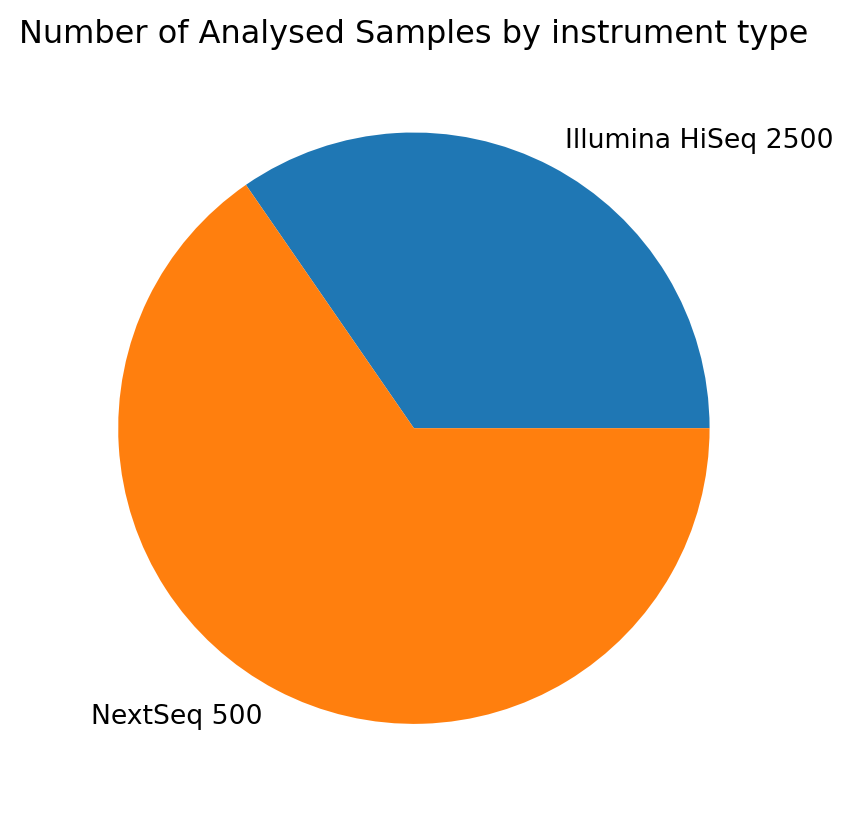
Example: distribution of instruments used for the Analysed Samples
import matplotlib.pyplot as pltanalyses.groupby('attributes.instrument-model').size().plot(kind='pie')plt.title('Number of Analysed Samples by instrument type');